An important part of profitable trading is learning how to evaluate risk to reward, first of all what is risk to reward?
Analyzing Risk to reward is an important evaluation process before considering a trade in the market. It essentially is determining the full risk of a position in relation to the potential reward of that position if it hits your target or target levels.
Let’s say you are evaluating a position in a support level and its risk in dollars is a total of $2000 dollars, however the potential on the position based on your trading plan and structure areas on the chart is a 3 to 1 reward to risk ratio. What this means is that you are willing to lose $2000 in order to potentially make $6000 dollars if price hits your target.

Risk to reward evaluation is such an important part of trading because not all trades will be winners, in fact I always suggest traders to expect that half or around half of there positions will be losses. Because of that reason risk to reward being higher on the winning positions gives a trader an edge, especially when going through a painful losing streak.
Another way of looking at it is as a tool to put more odds in a traders favor from a gain perspective.
Let’s say you took 10 trades, 10 trades with a 3 to 1 reward to risk profile and 5 ended up being losses out of those ten, however 5 reached there target, what would that mean, well if each trades risk in dollars was $1000 dollars, that would mean a total loss of $5000 dollars out of those ten trades, however a total gain of $15,000 from the 5 winning trades reaching there targets. Overall a $10000 dollar gain on the trading account. So even with half the trades being losses the winning trades built the account by $10000 dollars in size and to think only a 50% winning rate with this example.
In essence it is not how much you make from every trade, it is how much you make over time from your winning trades in comparison to your losses. If your winning trades cover multiple losses in a row it becomes much easier to deal with a losing streak.
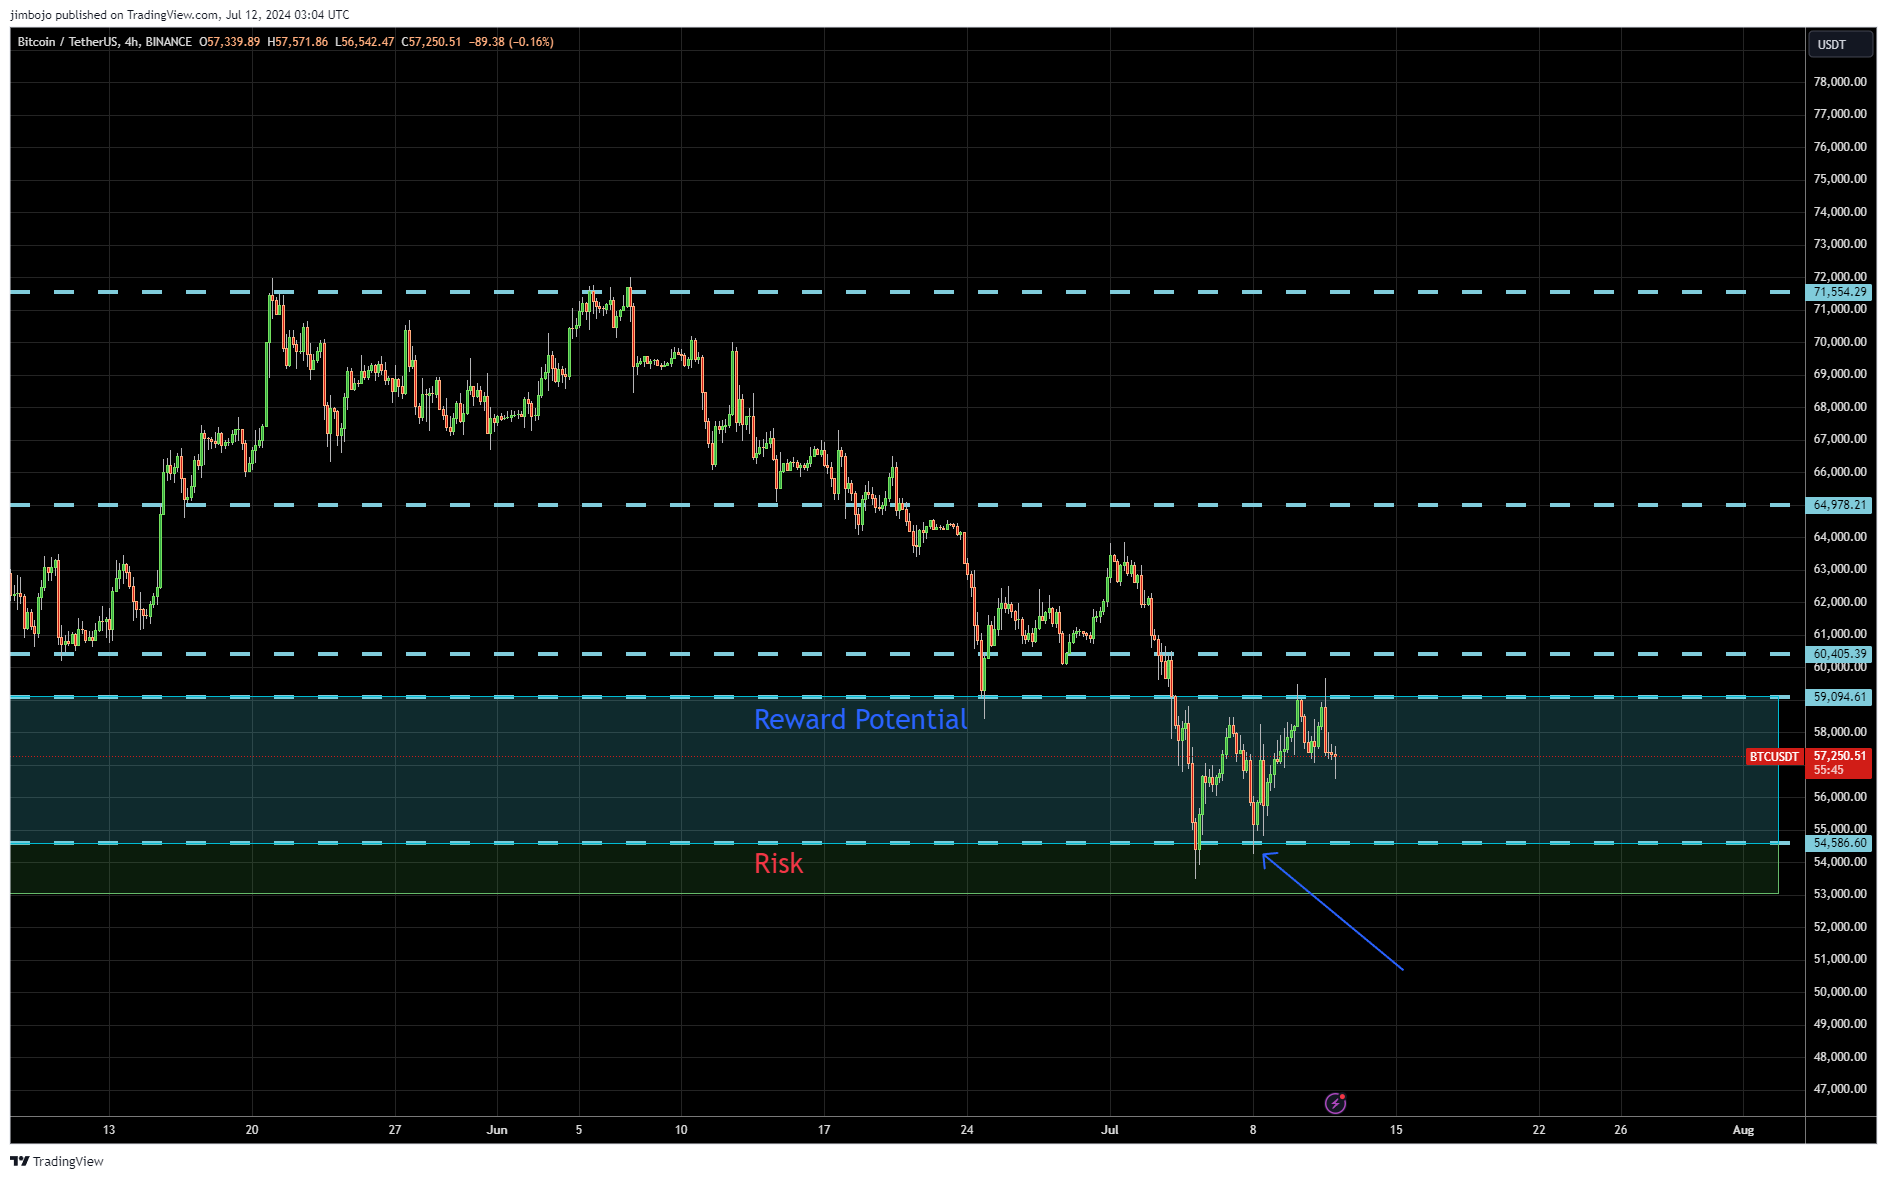
Above is an example on BTCUSDT of a retest of recent structure potential buy trade opportunity where risk was around a third of the potential reward, in other words a 3 to 1 reward to risk profile potential trade. Blue arrow indicating a potential buy entry spot ( area to place a potential buy order ) on the chart when price retested this area.
Area in green in this example on the chart is the area of risk ( at the bottom of this area a stop loss would be placed ) and area of blue potential reward ( top of this area a take profit order would be placed ). Click image for a larger view.