The Doji candle is a candle that can signal to a price action trader a potential reversal in the market, in particular when price is testing within a important support or resistance area.
These types of candles are often very small in size, they are indecision candles because price has failed to move much to the upside as seen by the close of the candle as well as price has failed to move much to the downside suggesting traders are disagreeing about price direction.
A Doji indecision candle in a support zone or a resistance zone can represent to a trader that price is potentially about to change direction. Because of that reason traders can use these types of patterns for considering a trade in the market such as a reason to sell in a resistance zone area or buy in a support zone. Because of their small size risk is often very small allowing for a higher reward potential trade than some other candlestick patterns, however this is not without a bit more risk as a Doji candle can be more often a false signal than an engulfing candle or pinbar candle.
Either way they are great candlestick pattern to trade in my opinion in particular within a support area or resistance area.
The next candle close after a Doji can also be used as a guide for a trade to increase the probability of a reversal price action signal ( in particular in a support or resistance area ) . As an example a bearish candle close after a doji in a resistance area ( potential sell signal ) or a bullish candle close after a doji candle in a support area ( potential buy signal ).

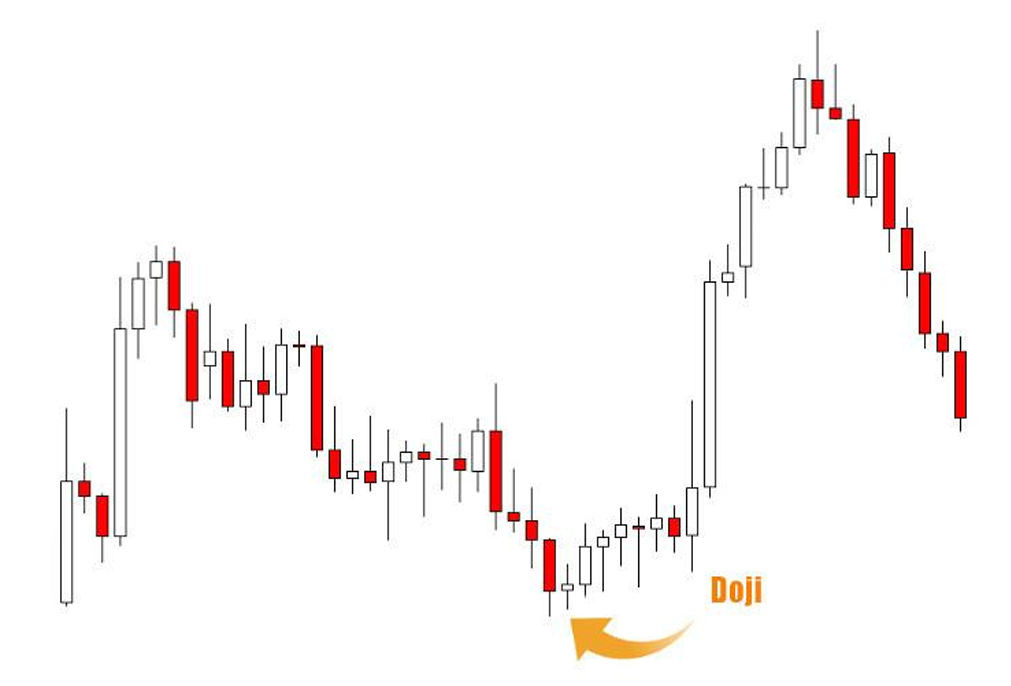
Above showing a example of a Doji / Spinning Top Candle at a low, these types of candles are neutral in the market and often appear before a transition. That transition can either be continuation or a change of power from bears to bulls like seen above. Both Doji and Spinning Top type candles I see as in the same category.

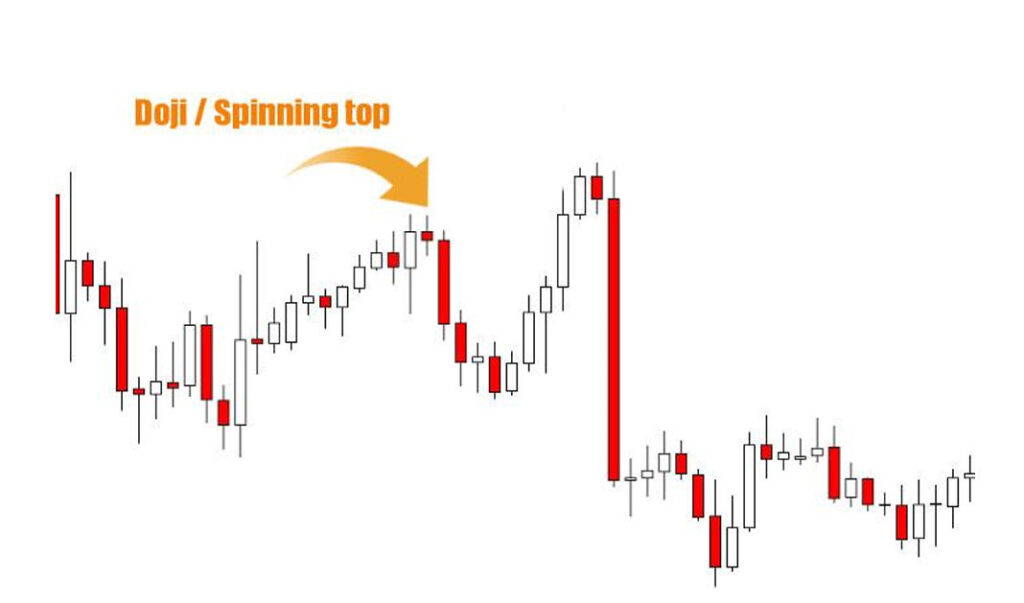
Above showing a Doji / Spinning Top at a high in the market and showing a small transition to the downside after. The best way of describing a Doji type candles is it represents a close to neutral battle between buyers and sellers. To a trader this can be a clue that a price transition is about to happen.

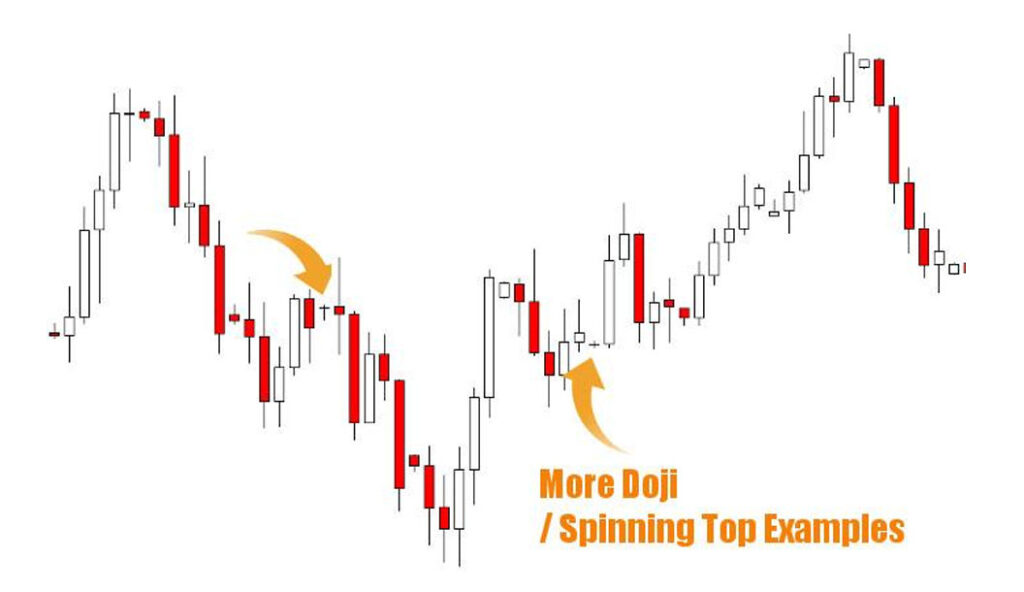
More Doji / Spinning Top or Bottom Candlestick Examples
Above showing some more examples of Doji like candles, one attribute being that they are usually very small in size showing that who has previously had control in the market
is most likely running out of steam. Decision from a Doji is defined by what happens next on a Doji or Spinning Top.
