Being able to identify strong areas of support or resistance on a chart is an important part of being a professional technical trader. It helps a trader determine where to consider a trade or to consider dollar cost averaging into a asset ( such as a $Stock or $Index or $Gold, $Silver or $BTC ).
First of all, what is a Support and Resistance Area?
A support or resistance area is a price area on the chart price may turn when price tests within that area. It is often an area where emotional traders or inexperienced traders take losses and thus an area where a professional experienced trader can find an entry. These areas can also be referred to trading zones, supply or demand zones or structure zones.
So, how do you Identify and draw strong areas of support and resistance, yeah good question, I will be doing a comprehensive video on this shortly which will be added here, however for right now let me explain in words as well as some illustrations below, what you want to be doing is looking for is areas where price has bounced significantly in the past from multiple times ( at least 3 times or more times, the more the stronger ). As for how significantly, you want to identify areas where price has bounced at least 100 pips or more multiple times. Anything less and it is not indicating a significant area and just a normal minor area of support or resistance.
To draw these areas on the chart I suggest starting on the line chart on the weekly, then dropping down to the daily and making any slight adjustments, then going back to candles and drawing in the zones. You then as an option could drop down to the 4 hour and make any further adjustments however this is optional. I do not suggest going any lower than the 4 hour when identifying important levels of support and resistance as we want to eliminate any minor forms of these areas to look for trading opportunities. This is essential for increasing the probability of a trade potentially being a great trade ( a successful profitable trade ).
Once you have identified these important areas on the weekly and daily ( and optionally the 4 hour ), go back to candles and draw in the areas on the candlestick chart on the daily or the 4 hour.
An aspect to be aware of that structure support or resistance is not a specific price, it is an area of support or resistance ( a trading area ). Many traders in the early years of learning to trade think they can determine a specific price of structure, however over time they soon realize like other experienced technical traders that this is not the case, they are areas. In a way you can see them as areas where price likes to test within and then bounce if they do hold similar in a way to trampoline however in this case for price movements.
Thus, knowing that these areas can hold gives a professional trader a huge edge in the market when looking for that next great trading opportunity. It also teaches traders to be patient while waiting for price to test within one of these areas before looking for the next great buying or selling opportunity.
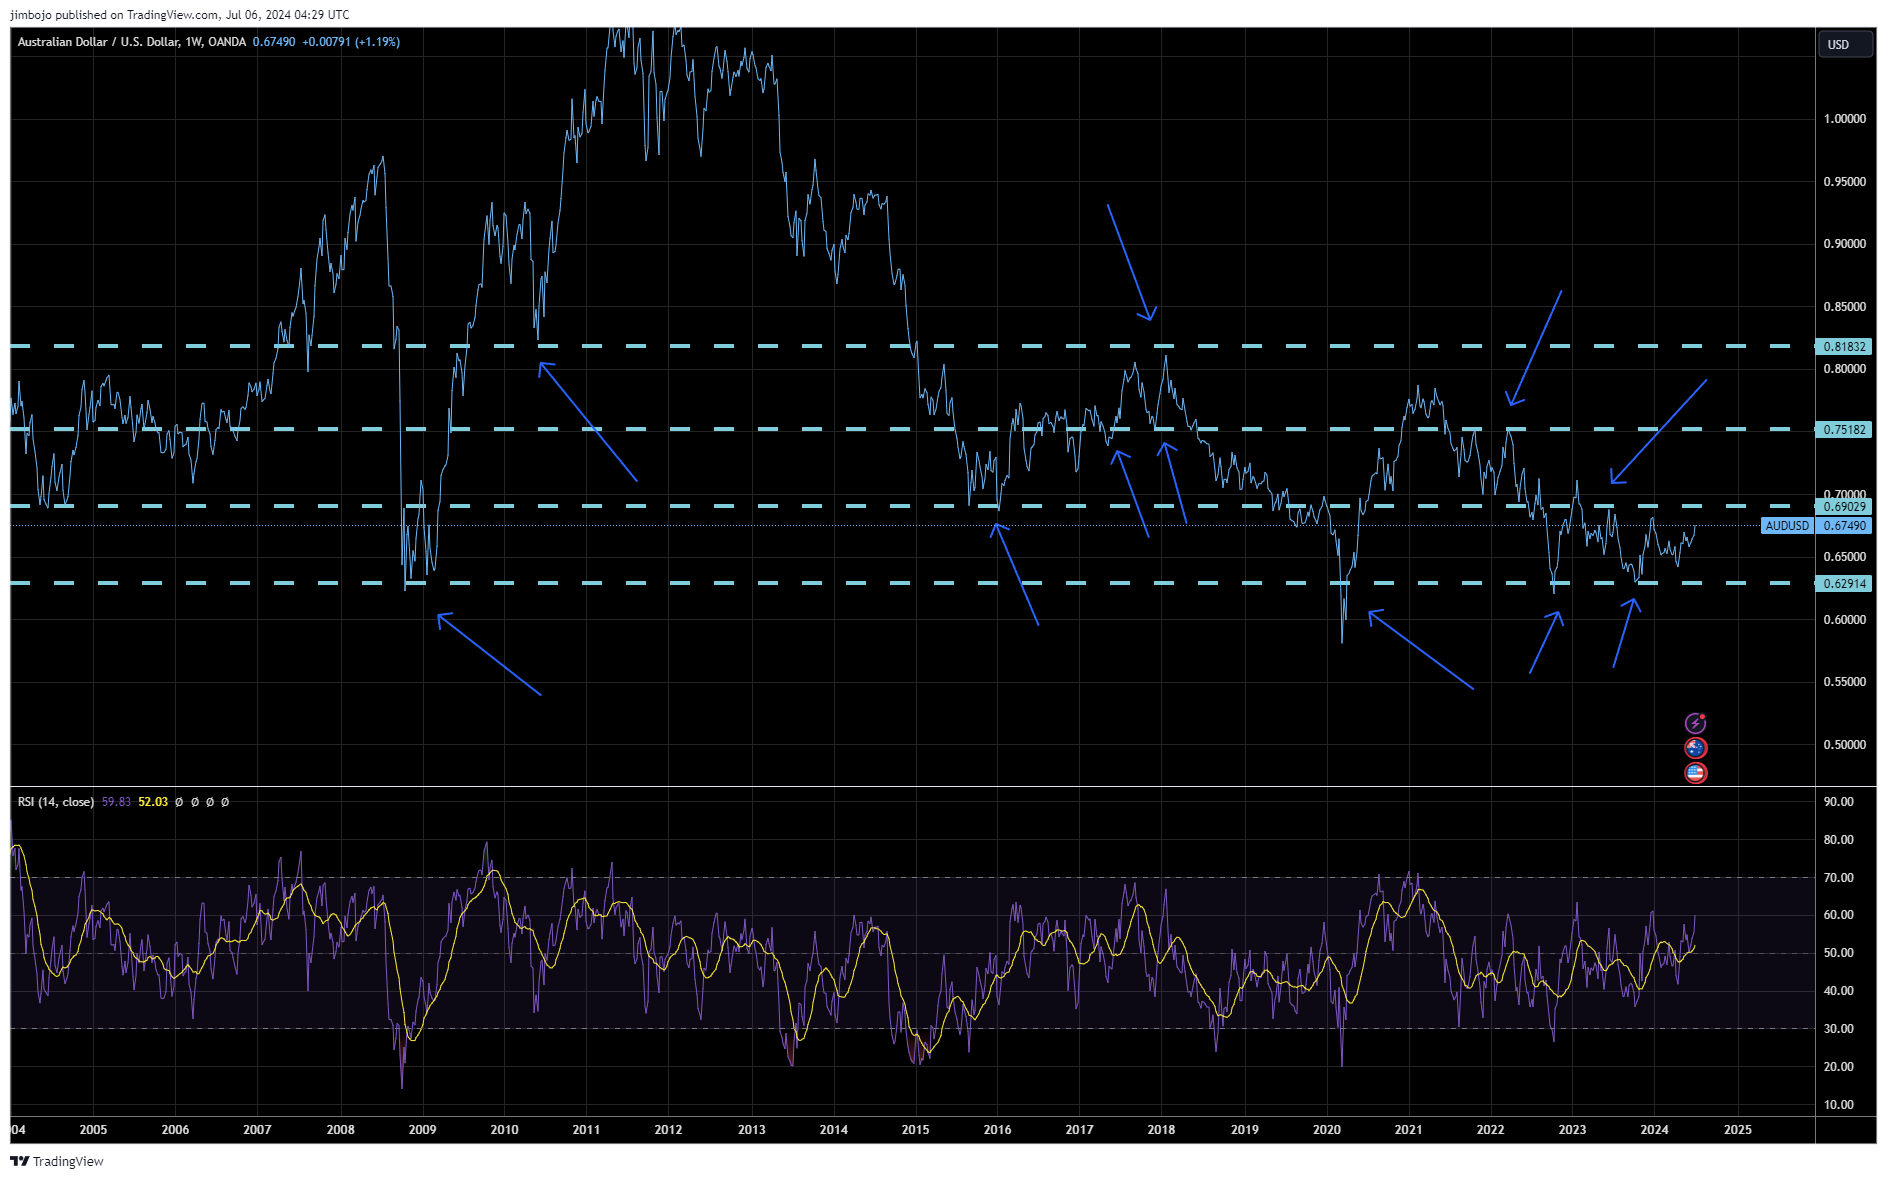
Weekly:
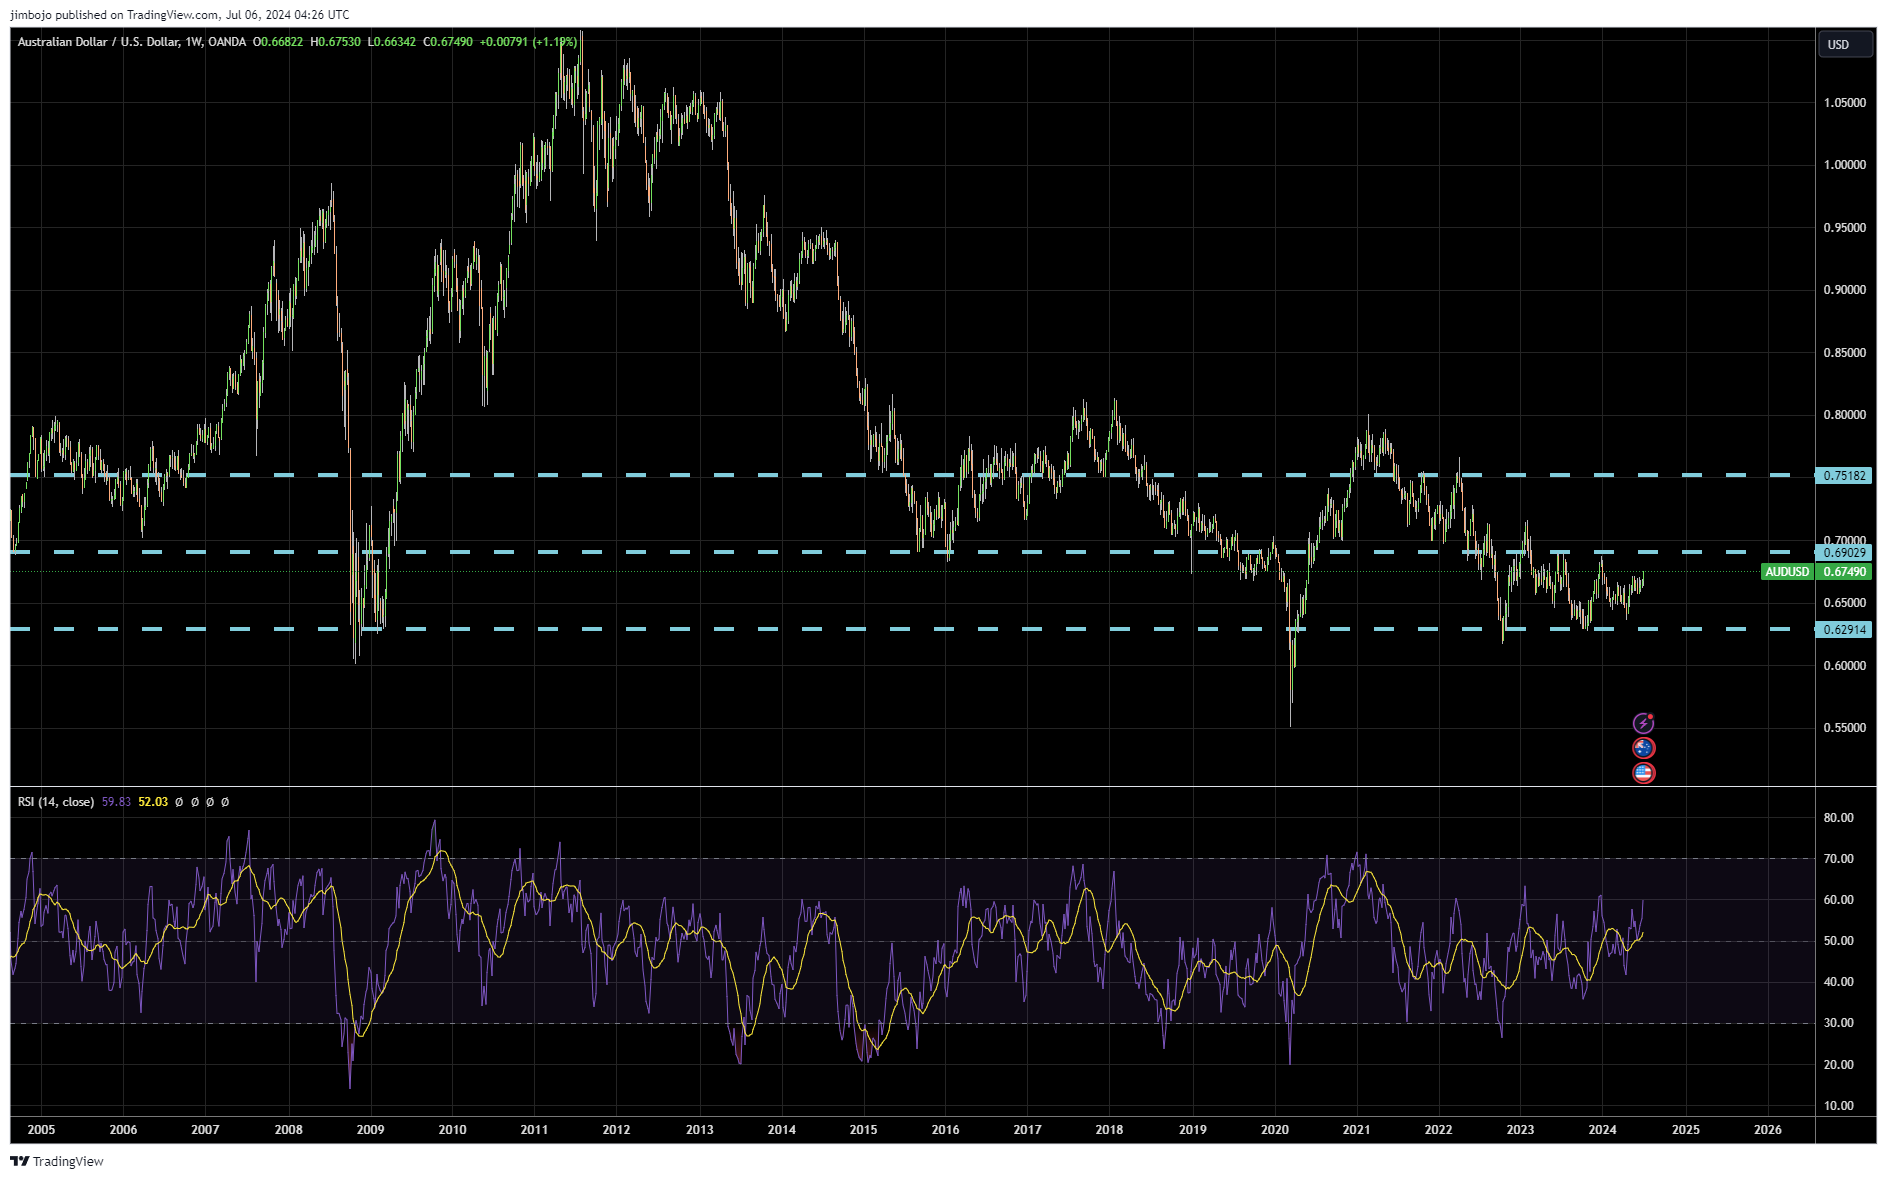
Draw on line chart or zoomed out candlesticks ( both work fine ). Look for areas where price has turned significantly in the past and recently.
Daily:
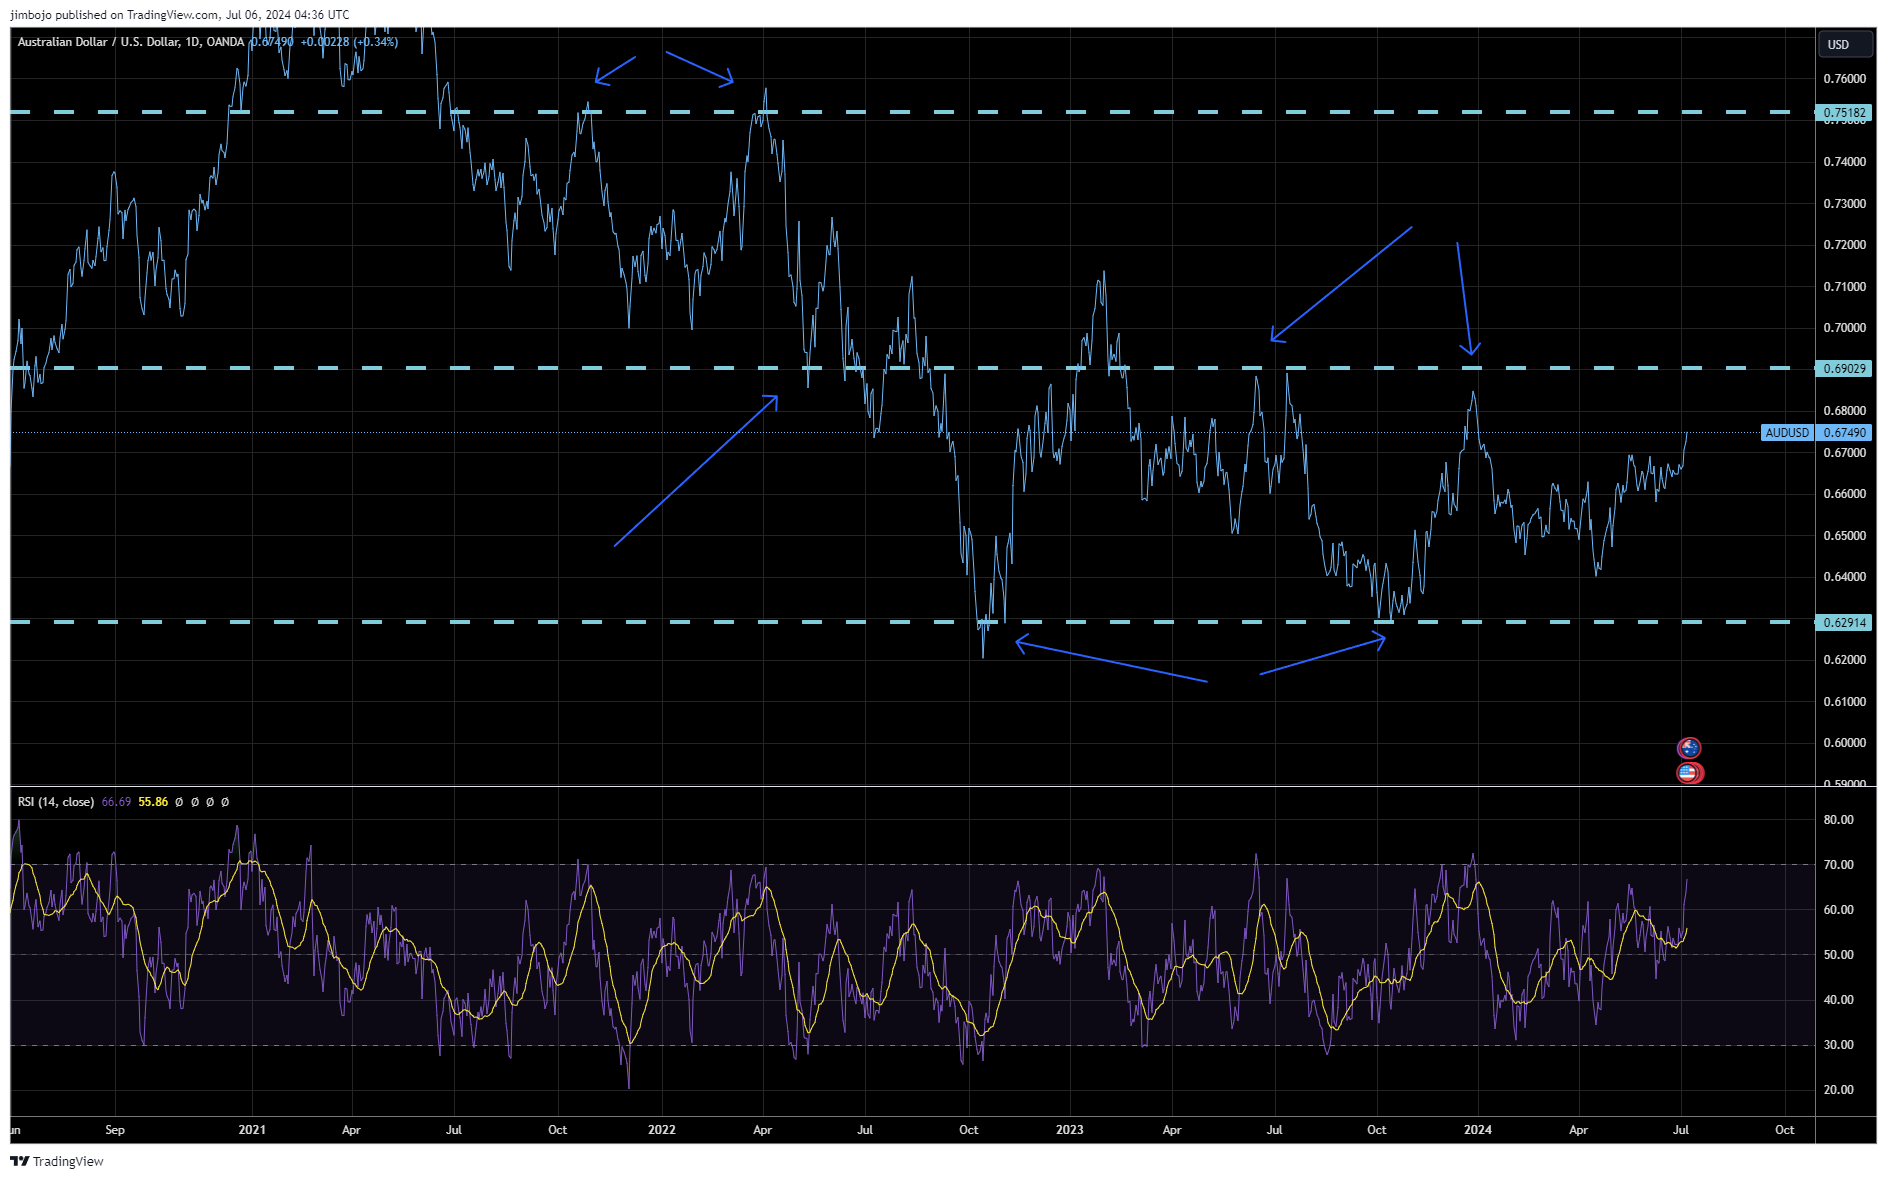
Dropping down to daily, make any slight adjustments of the zones on a zoomed out candlestick chart or line chart.
Do you see the clear trading areas, are they starting to pop out?
Draw the Trading Zones on Candlestick Charts ( Adjust as needed ):
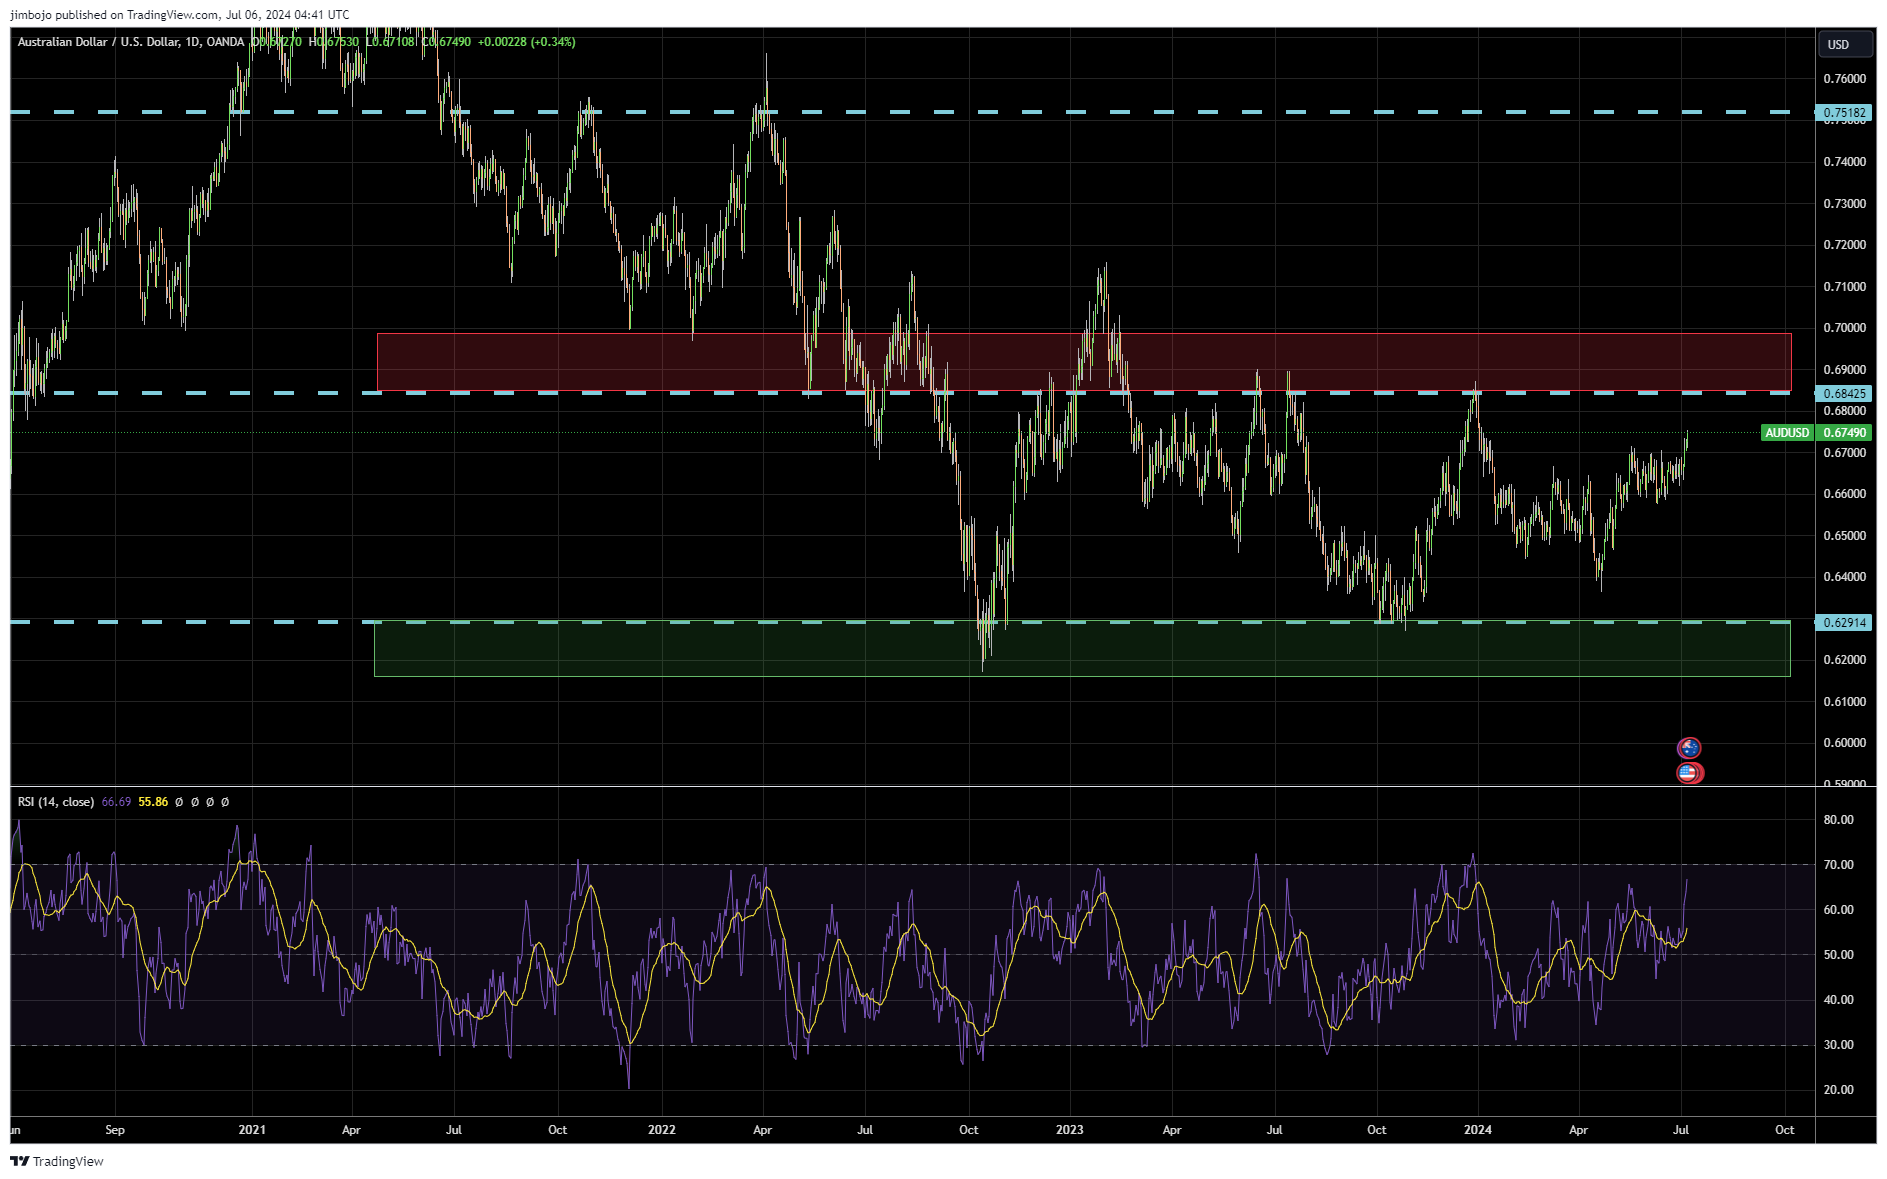
Now let’s go to the daily chart with candlesticks on and draw the trading areas, they should start to pop out at you after going through the process, areas above price are resistance areas ( areas to potentially look for a selling opportunity ) and areas below price are potential support areas ( areas to potentially look for a buying opportunity ).
Area in green, a great area to look for a potential buying opportunity and the area in red a great area to look for a potential selling opportunity.
You can also drop down to the 4 hour to make any final slight adjustments as needed to these areas.
Now that you have drawn in these technical trading areas you can use them as potential areas to look for aligning price action opportunities ( selling opportunities in a resistance area and buying opportunities in a support area ) on the daily, the 4 hour, 1 hour or even lower.